
Designing a provider-roster
comparison module.
Milliman MedInsight provides healthcare analytics. Its Network Optimizer helps organizations evaluate provider networks and identify gaps in access to care. A provider roster is the list of providers in a network. Comparing rosters helps an analyst understand how changing that list could affect access, compliance, and cost. About Network Optimizer ↗
Why this matters: A roster change can shape whether people can find an in-network provider close to home. Giving analysts a clearer way to compare options helps them spot access gaps and focus on changes that could make care easier to reach.
As a Product Strategy Intern on the Product Development team , I designed a new roster-comparison module from the ground up. Leadership supplied the brief and constraints. My responsibility was to work out the workflow and interface within Milliman’s existing design system.

- Role
- Product Strategy Intern
- Team
- Product Development
- Foundation
- Existing design system
Working out what comparison needed to mean.
The module did not exist, and there was no module-specific documentation to build from. There were useful resources around it: previous user research, existing Figma files, and the design system. I reviewed those first, then sketched the flow.
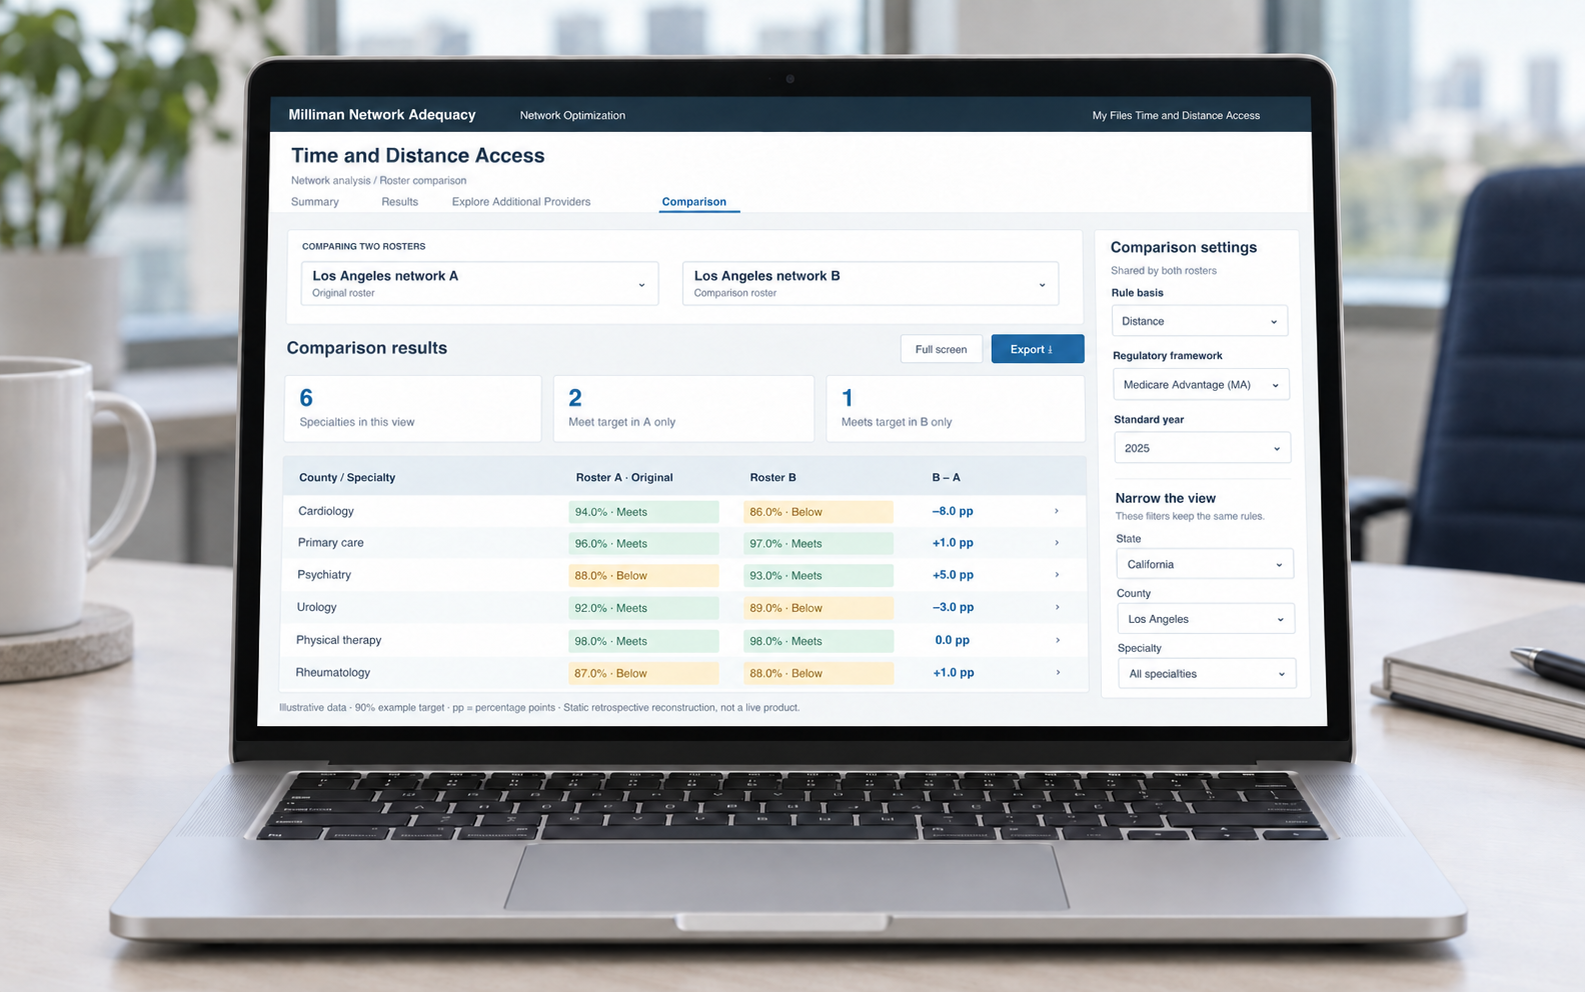
The request went beyond showing two provider lists. Analysts needed to see where networks differed against the same requirements, understand the providers behind a difference, and consider what to change. That matters because a network can meet a requirement for one specialty or location and miss another.
The broader concept could support comparing two or more rosters. I focused the brief on two, then worked through roster selection, the comparison matrix, summaries, and the supporting actions before extending the what-if flow.
Choose the rules once, then compare.
I started with the order of operations: select the first roster, set the rules, and add the second roster under those same rules. If the requirements changed between columns, the analyst could mistake a settings difference for a network difference.
The shared settings were rule basis, such as drive time or distance; regulatory framework, such as Medicare Advantage (MA), Qualified Health Plan (QHP), or custom; and standard year. State, county, and specialty filters would narrow the visible results without changing those underlying rules.

Roster identity
Make the starting roster easy to recognize.
I considered how someone would add or remove a roster, find it in My Files, rename it, and distinguish a revision. I explored several entry points before developing the comparison tab.
Review feedback called for an indicator for the original roster. That detail mattered once two similar lists sat beside each other: the analyst needed a stable reference for interpreting a change.
The sketches also explored a return to the original or single view. Keeping these actions visible takes space, but leaves less for someone to remember.

Show the gap behind a pass or fail.
I developed the comparison matrix around roster columns and county-by-specialty results. A color-coded status could show where one roster met a requirement that another missed. Percentages added the size of that difference.
I explored a compact status view and a denser view with progress bars. The choice was about how much explanation to put in the main table before it became difficult to scan.


Summary and detail
Give the analyst a next question to investigate.
After the table, I developed the results summary and KPI summary. The concept included measures such as “12 cardiology counties where Roster A is compliant and Roster B is not.” This was an illustrative KPI used to show how the summary could work, not a measured project outcome.
The intended drilldown would open provider-level comparisons from a difference in the matrix, showing who appeared in each roster and the related quality and cost measures. My sketches explored row selection, expanded columns, and a focused view while keeping summary context available.
I wanted the summary to identify where to look and the detail to help explain why. The extra step would need a clear entry point, especially when the table already had many columns.

Keep a proposed change separate from a saved revision.
Once the comparison table and summary were in place, I developed the fullscreen view, export action, and export pop-up. The broader export concept covered both the provider lists and summarized differences so analysts could take the comparison into a review.
I then began the what-if scenario. The intended flow was to choose a specialty, inspect suggested providers, add one to a particular roster, and see how the compliance and cost differences changed. I developed the beginning of this flow, not a completed simulation.
The sketches explore an explicit apply action and call for change history. A proposed edit should not be confused with a saved roster revision. Adding a confirmation step takes longer, but gives the analyst a clear point at which to commit.


The map needed its own decisions.
The map introduced another challenge: where it should sit beside the comparison, how each roster’s visibility should be controlled, and how to retain the original-roster context. I explored a shared map with per-roster summaries rather than treating geography as a separate screen.


The interface sits upstream of a patient’s drive.
For someone in a rural county who needs a cardiologist, network adequacy is not an abstract compliance box. It can shape whether the nearest in-network specialist is within a reasonable drive. Milliman describes Network Optimizer as a way to evaluate geographic access, identify gaps, and respond to regional provider shortages.
My comparison concept was designed to make that work more actionable. Instead of stopping at “this roster fails,” an analyst could see which county and specialty created the difference, inspect the providers behind it, and explore what a targeted roster change might improve before saving a revision.
Find the access gap.
The county-by-specialty matrix surfaces where one roster meets a shared travel standard and another does not.
See what drives it.
Provider-level detail connects a compliance difference to the clinicians present in, or missing from, each roster.
Test a focused change.
The intended what-if flow shows how adding a candidate provider could affect access and cost before the analyst commits.
The surrounding analytical workspace.
The brochure shows a specialty compliance summary and a provider-exploration view. These help explain the product setting and visual language. They were published after my internship and are separate from my comparison-module design.


What I brought back to the team.
I presented the comparison table, results and KPI summaries, fullscreen view, and export flow to the team. The review surfaced positive feedback and requested adjustments, which I incorporated into the next round of revisions.
The work gave the team a concrete module design to discuss, including the states and actions around the main table. I learned to give those details attention early: which roster is the original, which rules are shared, and whether an edit has actually been applied.
Documented output
Flows, low-fidelity sketches, comparison and summary designs, fullscreen and export flows, and the start of what-if exploration. This work reached design review, not a production release.
Proposed evaluation
I would check correct identification of the original roster, time to explain a specialty-level difference, and errors distinguishing proposed from applied changes.